Here you can find the technologies we developed in the lab.
Please contact us if you are interested in applying one of these tools and need our help.
Please contact us if you are interested in applying one of these tools and need our help.
Single Particle Profiler (SPP)
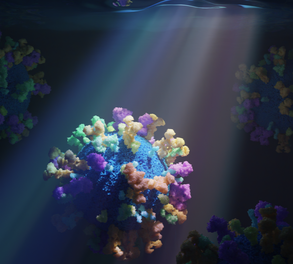
We introduce a method, single-particle profiler, that provides single-particle information on the content and biophysical properties of thousands of particles in the size range 5–200 nm. We use our single-particle profiler to measure the messenger RNA encapsulation efficiency of lipid nanoparticles, the viral binding efficiencies of different nanobodies, and the biophysical heterogeneity of liposomes, lipoproteins, exosomes and viruses. Briefly, fluorescently labeled particles diffuse through the diffraction-limited observation volume, where the fluorescence emissions from multiple channels are monitored continuously (as in fluorescence cross-correlation spectroscopy). Unlike fluorescence cross-correlation spectroscopy, which reduces all fluctuations into a single curve, we identify individual peaks in intensity fluctuations in multiple channels using a custom, freely available Python script. Based on the intensity of each individual peak in multiple channels, we construct a density plot and histograms for each individual channel. Therefore, like flow cytometry, this approach can be used to measure the fluorescence intensities in single nanometer-sized particles smaller than 200 nm. Such information can be used for content measurement and biophysical profiling of particles.
Key publications: Sych et al, Nature Biotechnology, 2023
Software: Sych et al, https://github.com/taras-sych/Single-particle-profiler

Multi-parametric and high-throughput platform for host-virus binding screens
Speed is key during infectious disease outbreaks. It is essential, for example, to identify critical host binding factors to pathogens as fast as possible. The complexity of host plasma membrane is often a limiting factor hindering fast and accurate determination of host binding factors as well as high-throughput screening for neutralizing antimicrobial drug targets. Here, we describe a multiparametric and high-throughput platform tackling this bottleneck and enabling fast screens for host binding factors as well as new antiviral drug targets. The sensitivity and robustness of our platform were validated by blocking SARS-CoV-2 particles with nanobodies and IgGs from human serum samples.
Key publications: Schlegel et al, Nano Letters, 2023

Spectral Imaging
Physicochemical properties of the plasma membrane are regarded to play an important role in cellular functionality. Among those properties the molecular order of the lipids, or the lipid packing, are of high importance, since this may introduce coalescence and conformational changes of proteins. A common way to infer membrane lipid packing is through using membrane-embedded polarity sensitive dyes, whose emission spectrum is dependent on the molecular order of the immediate membrane environment.
We here show that such spectral analysis on a scanning confocal fluorescence microscope can significantly be improved by using detectors capturing the full emission spectrum and applying an analysis that regards the whole spectrum. Using polarity sensitive dyes such as Laurdan or Di-4-ANEPPDHQ, you can accurately measure spatial heterogeneity in lipid packing of model and cellular membranes, revealing in great detail in these physicochemical properties of the plasma membrane.
Key publications: Amaro et al, Journal of Physics D, 2017
Software: Weber et al, Biorxiv, 2024
Fluorescence Correlation Spectroscopy
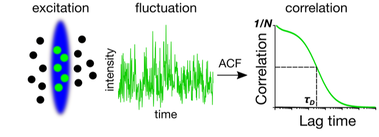
Fluorescence correlation spectroscopy (FCS) is a commonly used microscope-based approach to probe the mobility of fluorescently labelled molecules. In FCS, the autocorrelation function is calculated from the temporal fluctuations of the fluorescence intensity that are caused by transits of individual molecules through the microscope’s observation volume (Figure 1b). The autocorrelation curve can provide information on the concentration and brightness of the diffusing molecules. Most importantly, it reveals the average transit time tD through the observation volume, from which the diffusion coefficient D can be calculated.
Key publications: Schneider et al, Molecular Biology of the Cell, 2017; Pinkwart et al, Journal of Biological Chemistry, 2019
Software: Sych et al, Nature Biotechnology, 2023
Scanning FCS
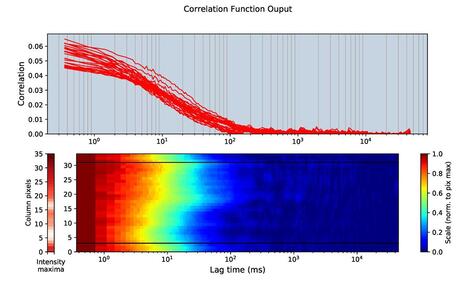
In sFCS, the observation spot is rapidly scanned along a line using a fast beam scanner. For each pixel on the line which represents a different point in space, an FCS autocorrelation curve can be calculated by temporally correlating the intensity signal in the very same pixel over time. These sFCS measurements can be performed in standard confocal microscopes and the correlation curves over space (so called correlation carpets) can be generated to infer on the general diffusional properties of the molecule of interest.
Use FoCus-scan for fitting..
Key publications: Schneider et al, Nano Letters, 2018
Software: Waithe et al, Methods, 2018
STED FCS
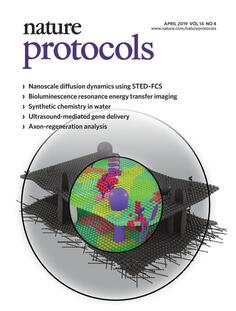
Spatially heterogeneous diffusion behavior is often caused by molecular interactions that occur at spatial scales smaller than the resolution limit. Consequently, FCS performed on a conventional confocal microscope (i.e., with d≈200 nm) may miss this heterogeneity because of inherent averaging over the entire observation volume. FCS can, however, be performed using sub-diffraction-sized observation spots on a STED microscope. FCS data recorded for varying STED laser intensities yield values of the apparent diffusion coefficient as a function of the observation spot sizes. This dependence of diffusion coefficient on the observation diameterd is generally referred to as the "diffusion law", and it reveals the heterogeneities in nanoscale diffusion.
Key publications: Schneider et al, MBoC, 2017; Sezgin et al, Nature Protocols, 2019

Giant Unilamellar Vesicles
In aqueous environments, lipid assemblies are easily transformed morphologically by changes of the physical parameters in the solution. Mild fluid convection, but also slowly alternating electric fields can lead to the vesiculation of a flat lipid multilayer, allowing the formation of unilamellar vesicles much larger than those prepared by sonication or injection methods, termed Giant Unilamellar Vesicles (GUVs >1000 nm). Originally, GUVs were formed using DC electric fields (Angelova and Dimitrov 1986) though AC electric fields were later found to increase formation efficiency (Angelova and Dimitrov 1988). Besides having a great potential to selectively study single lipid species in a model membrane, it is also possible to form GUVs with complex lipid mixtures.
Key publications: Jenkins et al, Journal of Cell Science, 2018

Giant Plasma Membrane Vesicles (GPMVs)
Although non-lipid cellular components (such as functional membrane proteins) can be reconstituted into GUVs, these experiments are rather work-intensive and still only capable of reproducing a limited complexity, compared to the physiological situation. This is particularly true for the extensive variety of lipids in a native cellular membrane. An optimal complement to simple GUV models is a free-standing membrane which retains at least the compositional lipid complexity of a live cell membrane. Such a system is provided by so-called giant plasma membrane vesicles (GPMVs), which can be grown and harvested from native cellular membranes (Sezgin et al. 2012).
GPMVs can be used as model cell membranes at thermodynamic equilibrium. They retain most of the protein and lipid complexity of the cell membranes. Moreover, liquid-liquid phase separation can be observed in GPMVs, making them an excellent system to study cell membrane structure.
Key publications: Sezgin et al, Nature Protocols, 2012; Sezgin et al, BBA, 2012.

